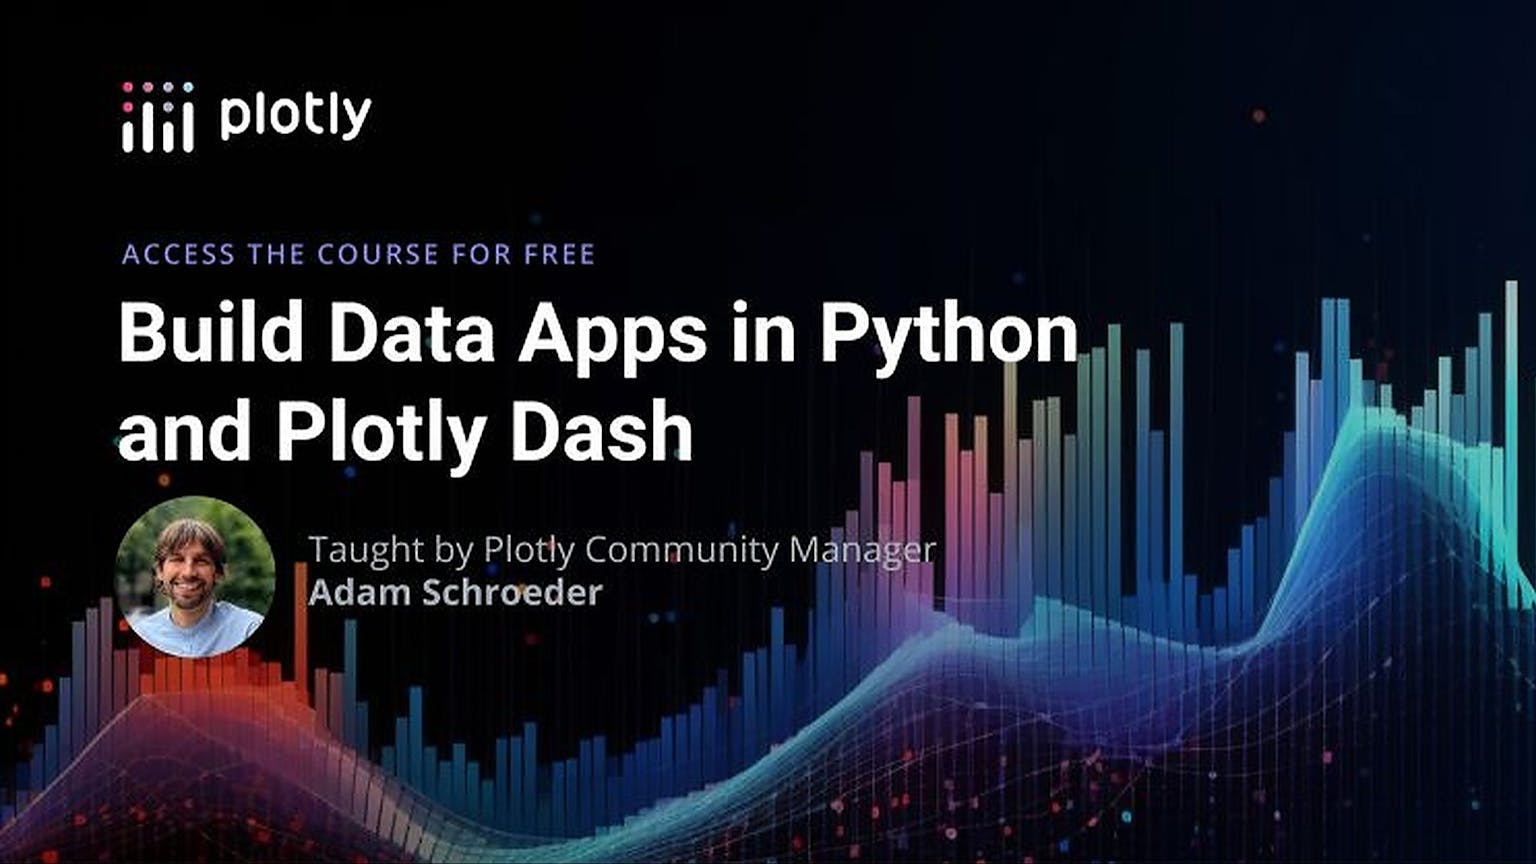
Build Data Apps in Python and Plotly Dash
4.6
(85 ratings)
3 Weeks
·Cohort-based Course
Learn how to build interactive web-based data apps in Dash (course is currently closed)
Build Data Apps in Python and Plotly Dash
4.6
(85 ratings)
3 Weeks
·Cohort-based Course
Learn how to build interactive web-based data apps in Dash (course is currently closed)
Course overview
Make Dash your most powerful toolkit for data analysis
These days, understanding data is key to making the best decisions for any business. However, the amount of information that’s available can be overwhelming for even the most data-savvy people.
So what’s the key to making data-driven decisions? Finding insight from data by formatting it in a way that’s easy to understand.
One of the easiest ways to present data for technical and non-technical audiences is to create a dashboard that neatly displays all of your data visualizations and insights in one place.
This course is for anyone who
01
Works in data
02
Is interested in building insights with Python
03
Wants to build on the web with Python
What you’ll get out of this course
Confidence working with and building professional data apps
- Create flexible, interactive, and customizable apps that connect directly to your analytics code
- Share your apps and insights with others directly on the web
Knowledge on how to explore your own data sets
- Use the Plotly Dash toolkit to better understand any data set, especially within your field of knowledge
- Take full advantage of over 100 Plotly chart types
Connection to a strong community of Dash users
- Establish connections with the rapidly growing community of Plotly Dash
- Get the support you need for a successful Dash learning journey long after finishing the course
This course includes
6 interactive live sessions
Lifetime access to course materials
6 in-depth lessons
Direct access to instructor
5 projects to apply learnings
Guided feedback & reflection
Private community of peers
Course certificate upon completion
Maven Satisfaction Guarantee
This course is backed by Maven’s guarantee. You can receive a full refund within 14 days after the course ends, provided you meet the completion criteria in our refund policy.
Build Data Apps in Python and Plotly Dash
Course syllabus
Week 1
Feb 5—Feb 11
Events
- Feb
5
Session 1
Session 1
Mon, Feb 5, 6:00 PM - 7:00 PM UTC
- Feb
8
Session 2
Session 2
Thu, Feb 8, 6:00 PM - 7:00 PM UTC
Modules
- Dash FundamentalsDash Fundamentals1 Lesson • 1 Project
- Dash App InteractivityDash App Interactivity1 Lesson • 1 Project
Week 2
Feb 12—Feb 18
Events
- Feb
12
Session 3
Session 3
Mon, Feb 12, 6:00 PM - 7:00 PM UTC
- Feb
15
Session 4
Session 4
Thu, Feb 15, 6:00 PM - 7:00 PM UTC
Modules
- Building GraphsBuilding Graphs1 Lesson • 1 Project
- Advanced App DevelopmentAdvanced App Development1 Lesson • 1 Project
Week 3
Feb 19—Feb 22
Events
- Feb
19
Session 5
Session 5
Mon, Feb 19, 6:00 PM - 7:00 PM UTC
- Feb
22
Session 6
Session 6
Thu, Feb 22, 6:00 PM - 7:00 PM UTC
Modules
- App Deployment and ResourcesApp Deployment and Resources1 Lesson • 1 Project
- Final Presentations of Dash AppsFinal Presentations of Dash Apps1 Lesson
4.6
(85 ratings)
What students are saying
Meet your instructor
Adam Schroeder
Adam Schroeder is passionate about helping people learn data visualization. He has helped the community grow by building 1:1 relationships, resulting in 1.5 million downloads of Dash per month. Prior to joining the team, Adam taught Plotly Dash for over three years on YouTube as @CharmingData, whose videos have over 60,000 views per month. Last year, he was inspired to co-author “The Book of Dash” to provide another learning method for people who want to learn Dash. He also launched the Dash Curriculum, an open-source tool for university professors wanting to teach Dash.
Be the first to know about upcoming cohorts
Build Data Apps in Python and Plotly Dash
Bulk purchases
Course schedule
4-6 hours per week
Personal app project
2 hours per week
Put into practice the knowledge you gain throughout the course by building your own personal Dash app.
Weekly projects
2-3 hours per week
Work on weekly course assignments provided by course instructor.
Live sessions
1:00pm - 2:00pm EST
Mondays & Thursdays with the course instructor.
Python Data Apps Crash Course
This recording will introduce you to Dash as a tool to build data apps in Python. It describes the core elements of Dash and Plotly. Watching it will help you prepare for the first session of this course.
Get this free video tutorial
Learning is better with cohorts
Active hands-on learning
This course builds on live workshops and hands-on projects
Interactive and project-based
You’ll be interacting with other learners through breakout rooms and project teams
Learn with a cohort of peers
Join a community of like-minded people who want to learn and grow alongside you
Frequently Asked Questions
What happens if I can’t make a live session?
I work full-time, what is the expected time commitment?
What’s the refund policy?
How much Dash and Python experience do I need for this course?
Be the first to know about upcoming cohorts
Build Data Apps in Python and Plotly Dash
Bulk purchases
